
One of the key value propositions of popular digital wealth managers, or robo-advisors, is that they help clients understand risk associated with the portfolios, instead of focusing only on the returns. Looking at the current market volatility, it is more important now than ever for customers to have a clear picture of the risks that they assume when choosing a robo-advisor or an investment portfolio.
While most robo-advisors typically employ modern portfolio theory (sometimes in conjunction with other well-researched methodologies) to construct investor portfolios, they use different ways to express risk levels associated with those portfolios. Most investment professionals agree that risk is as important a consideration as return in portfolio selection. In fact, the vast majority of practitioners continue to be inspired by the mean-variance optimization framework illustrated by Nobel Prize winner Harry Markowitz’s 1952 dissertation on portfolio selection.
However, risk is usually not as well understood by the average investor as expected returns. This is because an individual’s risk tolerance is driven not only by past performance and rational expectations, but also by unique personal circumstances and other emotional factors such as hopes and fears. Also, an individual’s risk tolerance is hardly a static measure. Most individuals would decidedly perceive their risk tolerance to be lower in 2020, due to uncertainties presented by Covid-19, than any time during the past decade. The desirability of a recommended portfolio is assessed by an investor partly by her perception of the portfolio’s riskiness. This is why it is vital for a robo-advisor to clearly illustrate risk, so that investors can understand the riskiness and relate it to their own tolerance, goals and emotional preferences.
Robo-advisors use quantitative or qualitative measures to help clients understand risk. Each measure has its advantages and limitations.
Qualitative measures – Aggressive or High Growth?
Many robo-advisors, such as Axos Invest (US), Wahed Invest (US) and Sarwa (UAE), assign a qualitative risk rating based on how investors answer a pre-defined list of psychometric questions. Wahed has a rating scale of 1 to 6, ranging from “Very Conservative” to “Very Aggressive”. Similarly, Sarwa has 6 rating levels for its conventional and socially responsible portfolios, ranging from “Very Conservative” to “Growth”.
A qualitative risk rating has obvious advantages, in that it makes perceiving riskiness of various portfolios relative to each other easy for an investor. For example, a portfolio assigned an “Aggressive” rating may be inherently riskier than one labeled “Conservative”. The psychometric questions help narrow down the investor’s tolerance for losses and identify the appropriate risk level.
However, a qualitative rating may not provide a clear understanding with respect to expected variability of the portfolio. It may not be obvious how much more volatile is an aggressive portfolio compared to a moderate portfolio. Most likely, a risk rating of 6 may not mean that the portfolio is twice as risky as one rated 3. Also, the perception of risk may vary based on how the risk rating is verbalized. Investors may view a high risk portfolio differently, depending on whether it is labeled “High Growth” or “Very Aggressive”. Hence such categorization introduces a layer of subjectivity to perceived attractiveness of a portfolio.
Given the above challenges with respect to qualitative measures, the below measures are sometimes preferred by robo-advisors to provide a quantitative view to riskiness.
Value at Risk
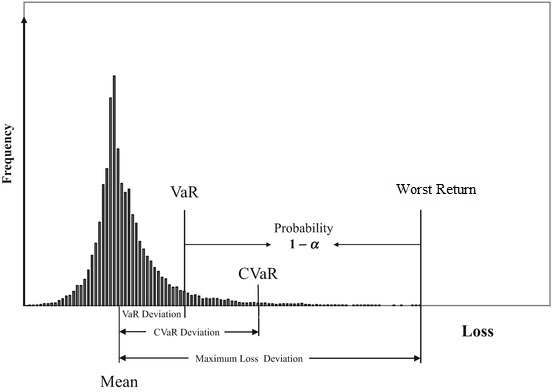
Value at Risk, or VaR, is the most popular measure of volatility of a portfolio. Simply put, VaR is a measure of minimum expected losses as a certain probability level (also known as confidence level or percentile). For example, if a portfolio’s 99% VaR is 12%, it means that there is a 99% chance that losses from the portfolio will not exceed 12% during a given period. In other words, there is a 1% chance that portfolio losses will be more than 12%. Stashaway, a prominent Singapore-based robo-advisor, uses a 99% VaR to assign risk rating to portfolios.
VaR can be calculated using different methods. The historical method sorts historical returns of a portfolio by magnitude and identifies the return observed at a certain percentile (typically 95% or 99%). The variance-covariance method assumes that returns are normally distributed, and uses the portfolio’s standard deviation to estimate where the worst 5% or 1% returns will lie on the bell curve. VaR can also be estimated using Monte Carlo simulation, which generates worst 5% or 1% returns based on probabilistic outcomes.
The popularity of VaR arises from the fact that it makes it easy for an investor to understand variability of a portfolio and relate it to her personal tolerance for losses. However, we can obtain different results depending on inputs and methodology used to calculate VaR, affecting the reliability of the measure. Also, VaR relies heavily on numerous assumptions, such as returns being normally distributed and aligned to historical returns. Finally, a 99% VaR of 12% (described above) does not inform the investor regarding how much losses can be expected in the worst case scenario.
Conditional Value at Risk
Addressing one of the shortcomings of VaR, the conditional value at risk, or CVaR, provides the expected loss to an investor in the worst case scenario. At a confidence level of 99%, the CVaR is calculated as the average portfolio returns in the worst 1% of scenarios. CVaR is estimated using similar methods as VaR. While it may help give a clearer picture of the worst case scenario compared to VaR, it may suffer from the same shortcomings due to the assumptions and methodologies used in estimation.
Best and Worst Returns
The best and worst returns relate to rolling periodic returns of a security or portfolio during a given time horizon. The return can calculated on daily, monthly, or yearly basis, depending on investor’s time horizon. The time frame is usually determined by availability of data. It can impact the best and worst observed returns if we do not use a long enough time horizon.
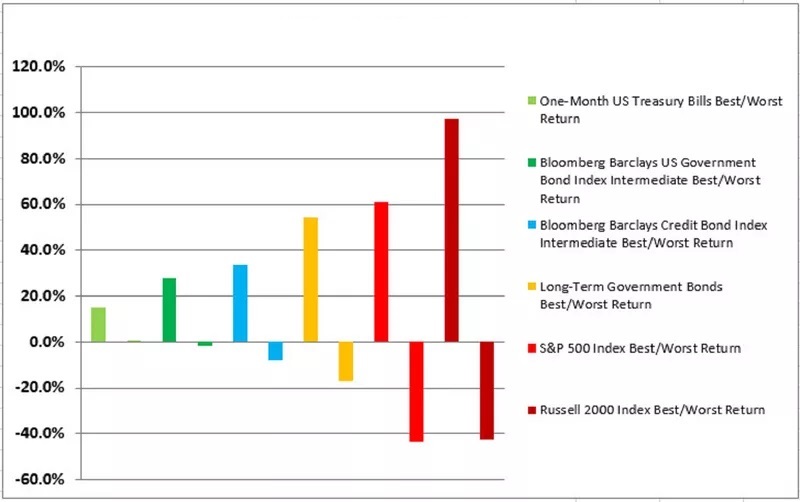
This measure uses historical returns to give investors an indication of best and worst case scenarios. One clear advantage of this measure is that, unlike VaR, it distinguishes between positive and negative returns, instead of assuming a normal distribution. Investors do not mind a positive volatility and mostly worry only about the downside risk. Also, unlike CVaR, it shows the absolute worst observed returns, instead of taking an average of returns which may underestimate the worst case scenario. However, like other quantitative measures, this tends to be backward looking and is also dependent on the data set of observed results.
Conclusion
Robo-advisors aim to democratize financial advice and bring high quality services, previously available exclusively to sophisticated investors and high net worth individuals, to younger investors and masses. Robo-advisors need to make their clients clearly understand the risk return trade-offs of their portfolio offerings, so that investors can choose the right portfolios that meet their personal needs. Given the limitations of the various risk measures, a combination of these may be best suited to provide a full picture of riskiness, without overly complicating the selection process.
Great article discussing algo based portfolio allocation and an introduction to Var and other related risk metrics.
Thanks a lot Aditya!